
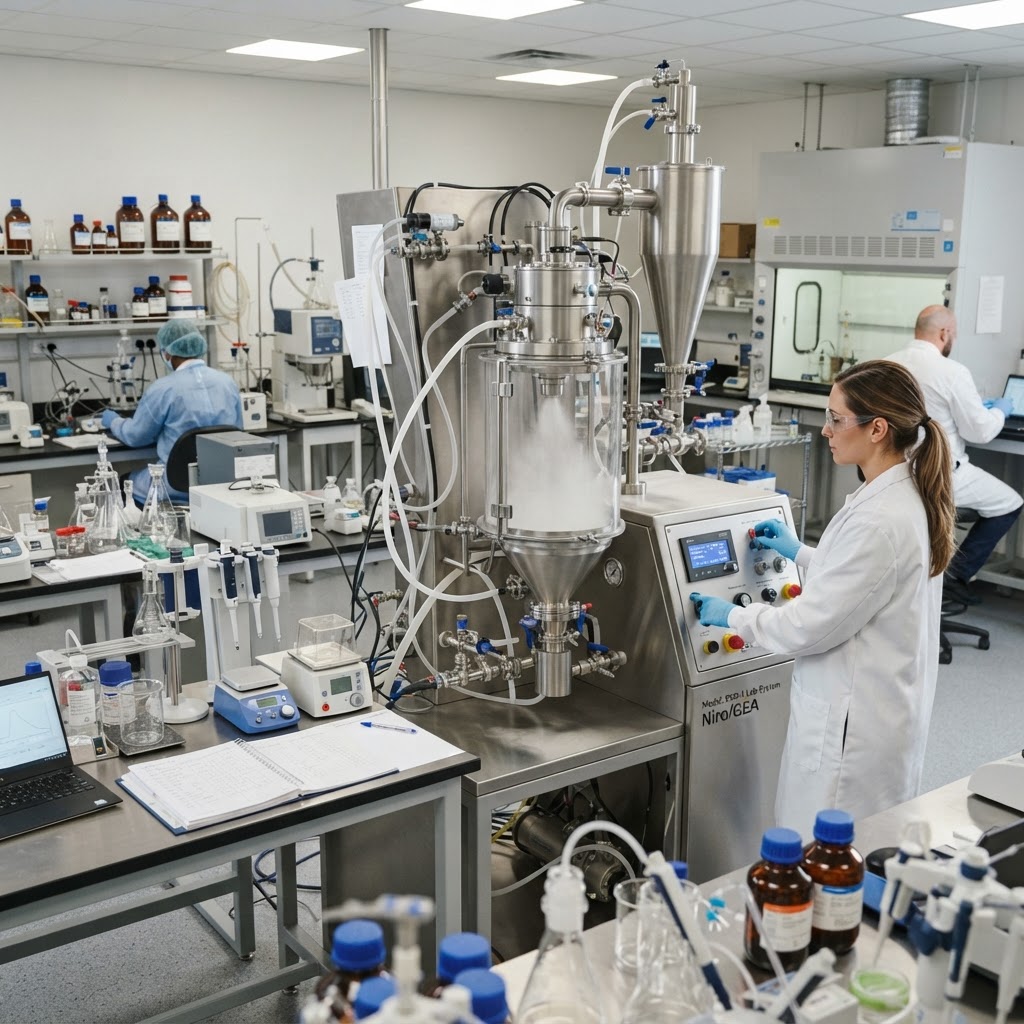
Process analytical technology is a defining area of real-time quality control, and organizations that prepare for it well tend to deliver more reliable programs, faster timelines and stronger outcomes for patients. This white paper examines process analytical technology through the lens of future outlook. It draws on widely recognized industry practice to help automation engineers, quality units and statisticians make informed decisions. The goal is to give readers sustained competitive advantage, supported by clear definitions, practical checklists and measurable indicators of success.
The discussion is organized into focused sections: the current landscape and its drivers, the main technical and operational challenges, proven approaches and tools, quality and regulatory considerations, performance measurement, and a staged action plan. Each section is written so that it can be read on its own, yet together they form a complete framework that can be adapted to programs of different size, modality and maturity.
The Current Landscape
Over recent years, process analytical technology has been reshaped by several converging forces. The most influential are real-time release goals, sensor miniaturization and regulatory encouragement. Together they raise expectations for speed, consistency and transparency while also increasing the complexity that teams must manage. Sponsors that once treated process analytical technology as a late-stage concern now consider it from the earliest design decisions, because choices made at the bench frequently determine what is achievable at commercial scale.
Why It Matters Now
The pressure to shorten development timelines has not reduced the need for rigorous science. If anything, compressed schedules magnify the cost of rework. When process analytical technology is approached reactively, teams often discover problems such as calibration burden or sensor fouling only after significant investment has been made. A proactive approach, grounded in future outlook, allows organizations to surface these issues early, when corrective action is least expensive.
Key Market and Technology Drivers
- •Real-time release goals: changes the baseline assumptions that teams use when planning process analytical technology.
- •Sensor miniaturization: creates new opportunities but also demands new skills and supporting infrastructure.
- •Regulatory encouragement: raises the bar for documentation, consistency and evidence of control.
- •Cross-functional collaboration: connects automation engineers and quality units so that decisions are made with full context.
Core Challenges and Risks
Every program in process analytical technology faces a recognizable set of risks. Understanding them in advance, and assigning clear ownership, is one of the most effective ways to protect timelines and budgets. The risks below appear repeatedly across projects and deserve explicit attention in any plan focused on future outlook.
Technical Risks
Calibration burden is among the most common technical concerns. It tends to emerge when processes are transferred or scaled without a full understanding of the factors that influence performance. Sensor fouling presents a related challenge, particularly when materials, equipment or analytical methods change between development stages. Left unmanaged, either issue can lead to delays, additional studies or reduced confidence from reviewers.
Operational and Organizational Risks
Beyond the science, data overload often reflects weaknesses in planning, communication or governance. Teams working on process analytical technology typically span several functions and sometimes several organizations. Without a shared view of priorities, automation engineers may optimize for one objective while statisticians optimize for another. Regular joint reviews, a single source of truth for data and clearly defined decision rights reduce this friction considerably.
Common Warning Signs
- •Repeated minor deviations that point to an unaddressed root cause such as calibration burden.
- •Growing variability in out-of-specification rate between batches, studies or sites.
- •Delays in decision-making because data are scattered across systems or teams.
- •Late discovery of requirements that should have been captured during early planning.
Proven Approaches and Enabling Tools
Successful organizations combine sound scientific method with the right enabling technology. For process analytical technology, three capabilities stand out: chemometric models, soft sensors and multivariate control charts. None of these is a silver bullet, but each addresses a recurring weakness when applied thoughtfully and supported by trained people and well-written procedures.
Applying Chemometric models
Chemometric models gives teams greater insight into how process analytical technology behaves under realistic conditions. The strongest implementations begin with a clear question, such as which variables most influence out-of-specification rate, and then design experiments or monitoring plans to answer it. Results are captured in a form that can be reused by later programs, turning individual project knowledge into an organizational asset.
Leveraging Soft sensors
Soft sensors complements the first capability by tightening control and reducing manual effort. When integrated with existing quality systems, it shortens the time between an event and a corrective response. It also frees quality units to focus on interpretation and improvement instead of routine data handling, which improves both morale and the quality of decisions.
Embedding Multivariate control charts
Multivariate control charts is most valuable when it is embedded early rather than added late. Early adoption allows the supporting methods, training and documentation to mature alongside the process itself. Organizations that wait until commercialization frequently find that retrofitting costs more than the original investment would have, and that regulatory questions arise that could have been answered with earlier data.
Practical Implementation Checklist
- •Define the objective and the critical success measures, including out-of-specification rate and release cycle time.
- •Map the process or workflow and identify where calibration burden and sensor fouling are most likely to arise.
- •Select tools such as chemometric models and soft sensors based on fit rather than novelty.
- •Assign an accountable owner to each risk and each action.
- •Document decisions and rationale so they can be reused and defended.
- •Review progress at defined intervals and adjust the plan using real data.
Quality and Regulatory Considerations
Regulators across major regions expect a science- and risk-based approach to process analytical technology. Expectations differ in detail, but common themes appear in guidance from the FDA, EMA, MHRA and other authorities: a clear control strategy, justified specifications, reliable data and demonstrated understanding of the process or product. Programs that treat future outlook as part of the quality system, rather than as a separate initiative, find regulatory interactions considerably smoother.
Building a Defensible Control Strategy
A defensible control strategy links what is known about process analytical technology to what is measured and controlled. It explains why each control exists, what risk it mitigates and how performance is verified over time. When calibration burden is a known concern, for example, the strategy should show the specific controls that address it and the evidence that they work. This traceable logic is what reviewers and inspectors look for.
Documentation and Data Integrity
Reliable documentation underpins every claim made about process analytical technology. Records should be attributable, legible, contemporaneous, original and accurate, with appropriate review and approval. Electronic systems should be validated, access should be role-based and audit trails should be reviewed routinely. Strong data governance also accelerates internal decisions, because teams trust the information in front of them.
Preparing for Inspection
Inspection readiness is a continuous state, not a last-minute project. Teams working on process analytical technology benefit from periodic mock inspections, clear storyboards that explain key decisions and ready access to supporting data. Involving statisticians in these exercises builds shared confidence and exposes gaps while there is still time to close them.
Measuring Performance and Value
What gets measured gets managed. A balanced set of indicators for process analytical technology should cover quality, speed, cost and reliability. Useful starting points include out-of-specification rate, release cycle time and sensor uptime. Indicators should be defined precisely, reported consistently and reviewed by people with the authority to act on what they reveal.
Selecting Meaningful Indicators
Choose a small number of indicators that genuinely reflect outcomes rather than activity. Leading indicators, such as the number of unresolved risks, help teams intervene early. Lagging indicators, such as sensor uptime, confirm whether those interventions worked. Together they provide a complete picture and discourage the temptation to optimize a single number at the expense of overall performance.
Using Data for Continuous Improvement
Trend analysis turns routine data into insight. Even simple run charts can reveal drift in out-of-specification rate long before a limit is breached. Sharing these trends openly with automation engineers and quality units creates a culture in which small problems are raised and solved quickly. Over time, this discipline yields more predictable performance and fewer unpleasant surprises.
Indicators at a Glance
- •Quality: out-of-specification rate
- •Reliability: release cycle time
- •Efficiency: sensor uptime
- •Compliance: inspection and audit outcomes, together with the closure time for corrective actions
A Staged Action Plan
Translating strategy into results requires a staged plan that fits the organization's resources. The following sequence has proven effective for teams focused on process analytical technology and future outlook. It can be compressed for small programs or expanded for large, multi-site initiatives.
Stage 1: Assess
Begin with an honest baseline. Review current practice against the themes in this paper, quantify performance using out-of-specification rate and release cycle time, and identify the gaps that matter most. Involve automation engineers and quality units early so that the assessment reflects real working conditions rather than documented procedure alone.
Stage 2: Prioritize
Rank improvement opportunities by impact and effort. Quick wins build momentum, while larger investments such as chemometric models or soft sensors may need business cases and phased delivery. Be explicit about dependencies, because a delay in one workstream often affects several others.
Stage 3: Execute
Run focused pilots before broad rollout. A pilot limits exposure, generates evidence and gives teams a chance to refine procedures. Track the agreed indicators, hold regular reviews and communicate results transparently so that stakeholders stay engaged and confident.
Stage 4: Sustain
Lasting improvement depends on embedding change in training, procedures and incentives. Update controlled documents, build the new practice into onboarding and revisit the plan at least annually. As continuous manufacturing and related forces continue to evolve, periodic reassessment keeps the approach aligned with reality.
Case-Style Illustration
Consider a mid-sized development organization that wanted to prepare for process analytical technology more effectively. Its initial review showed inconsistent out-of-specification rate, frequent rework linked to calibration burden and limited visibility across teams. By introducing chemometric models, clarifying ownership between automation engineers and statisticians, and reviewing release cycle time at a monthly forum, the organization reduced avoidable rework and gained earlier warning of emerging issues. Within a few program cycles, planning became more reliable and regulatory interactions required fewer clarifications.
The lesson is not that any single tool delivers success, but that disciplined application of future outlook, combined with clear accountability and honest measurement, compounds over time. Small, consistent improvements in process analytical technology accumulate into a meaningful competitive advantage.
Conclusion
Process analytical technology will continue to evolve as real-time release goals, sensor miniaturization and regulatory encouragement reshape expectations across real-time quality control. Organizations that invest in understanding risk, adopting suitable tools such as chemometric models and soft sensors, and measuring outcomes with indicators like out-of-specification rate are best placed to prepare for it successfully. By following the staged approach outlined here, teams can achieve sustained competitive advantage while protecting patients, timelines and budgets.
Readers who wish to explore related topics can browse the wider library of pharmaceutical and biotechnology white papers published by Biotechnology Media Insights, which covers manufacturing, formulation, regulatory strategy, supply chain and advanced therapies.
About This White Paper
This white paper is published by Biotechnology Media Insights Editorial, a trusted source for pharmaceutical and biotechnology research, technical guides and industry analysis.